In-situ measurement strategy (Standards are adopted according to the JECAM | SAR Inter-Comparison Experiment):
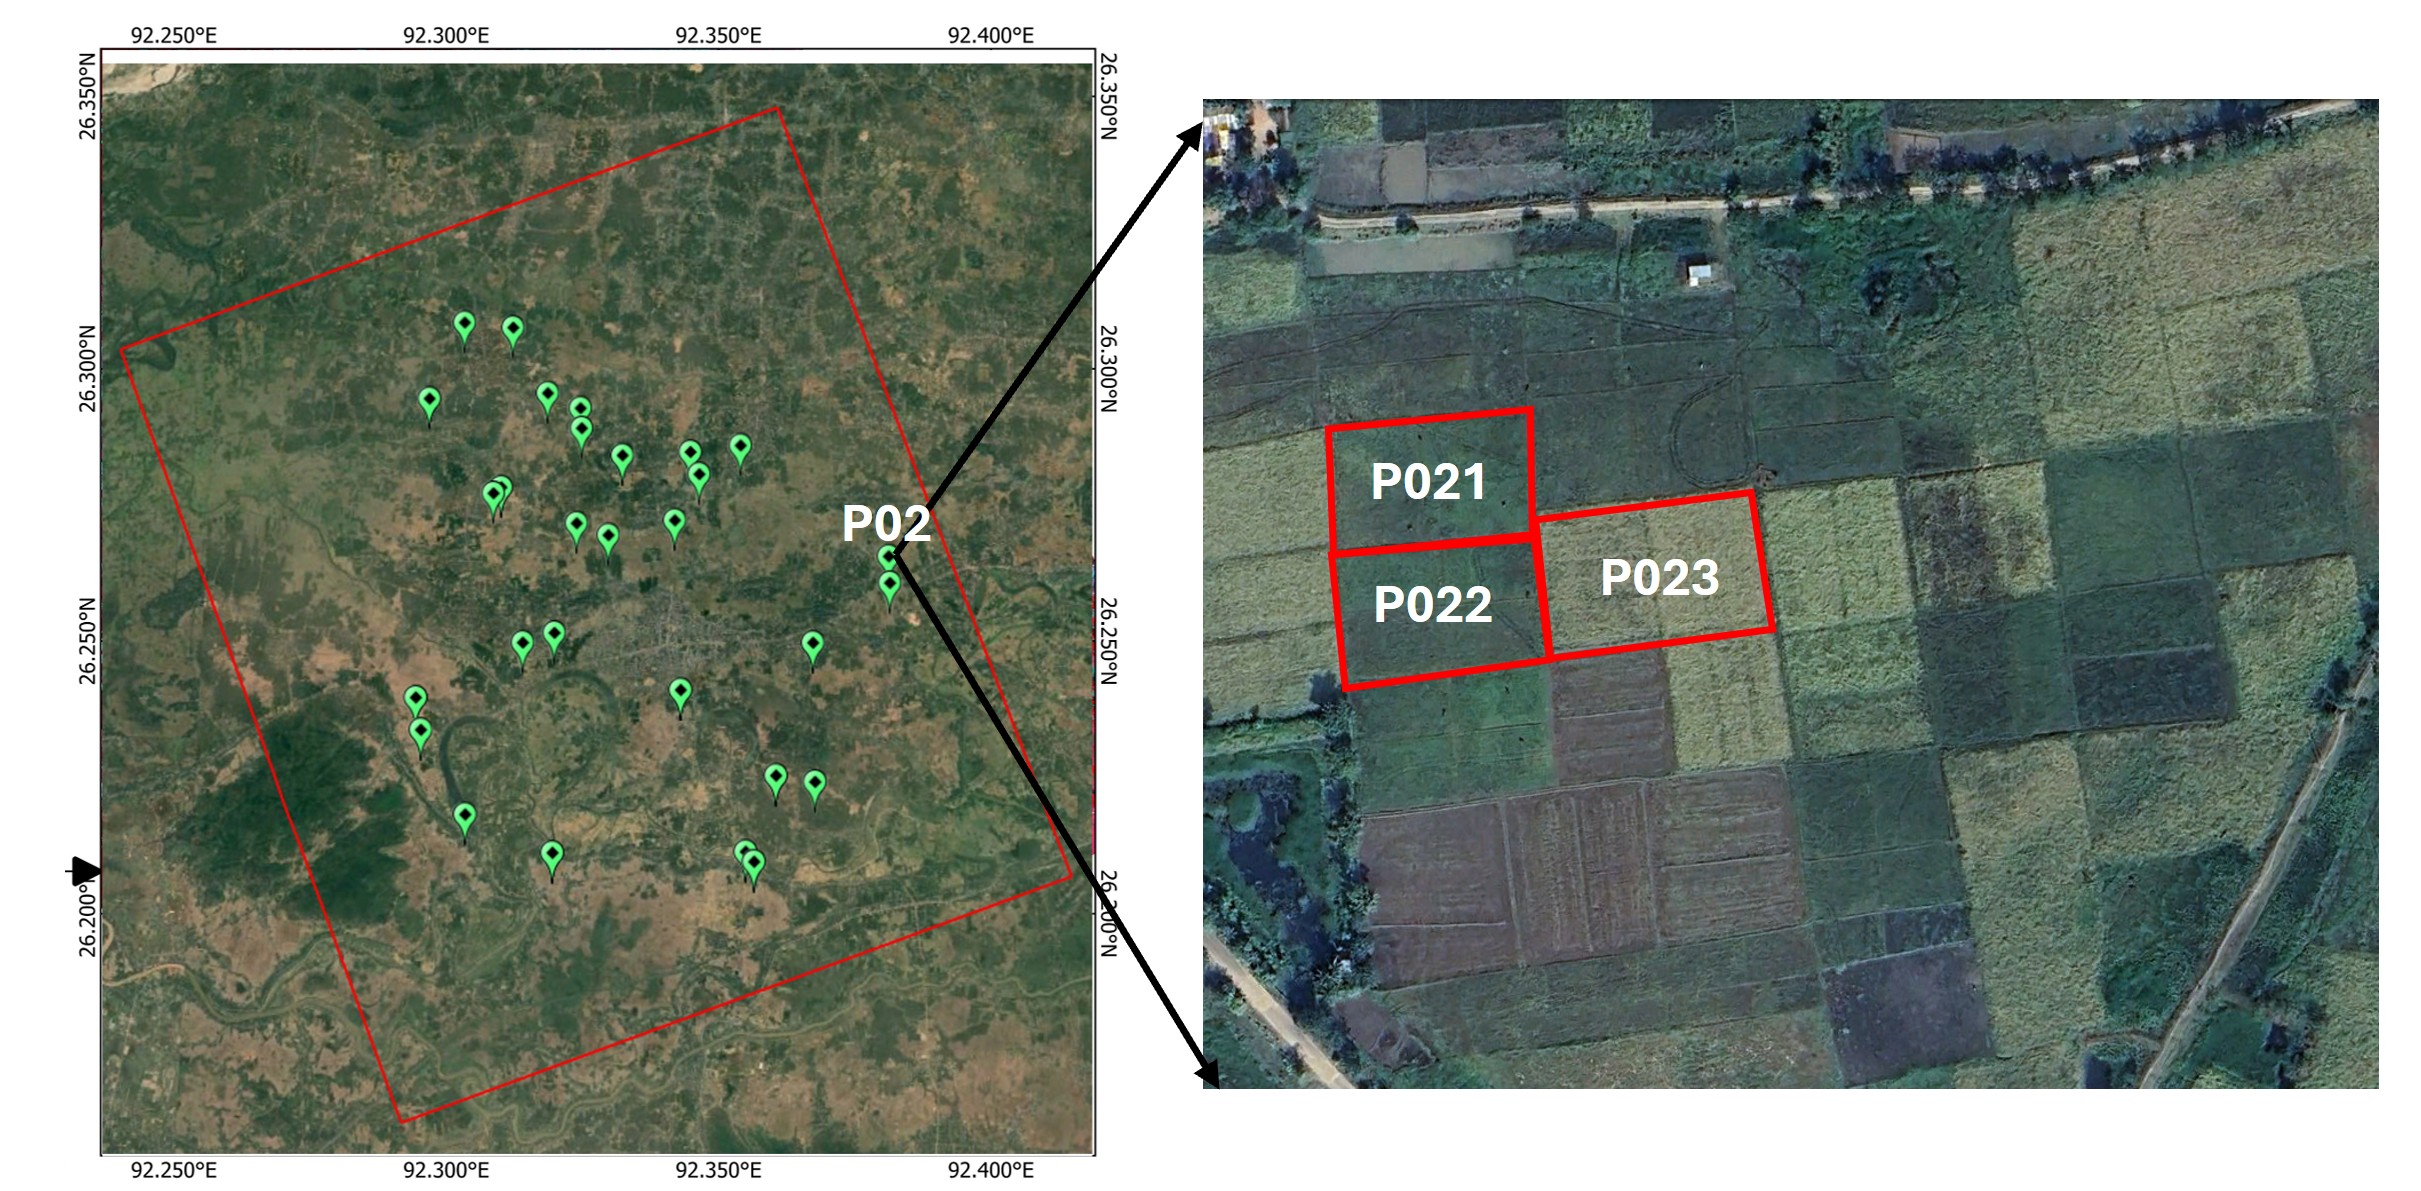
The field samples will be collected from 19-20 sites (with 2-3 field plots per site) for kharif and Rabi seasons. For each plot, sampling points will be selected as following figure. At each sampling point both the vegetation and soil parameter will be collected during the campaign.
Field Sampling strategy:
I. Agronomic management practices
Date of sowing/transplantation
Irrigation practice (Rainfed/partial irrigation/canal)
Crop varietry information
A. Soil Moisture
Hand-held Soil Moisture Sensor Measurements: Surface soil moisture measurements will be acquired over selected agricultural fields coincident in time to satellite overpasses.
The hand held WET150 Sensor (Delta-T Devices Ltd., Cambridge, UK) will be used to measure soil moisture content, temperature, and electrical conductivity (EC) at near surface depths (5cm) at 2 locations in each field plot.
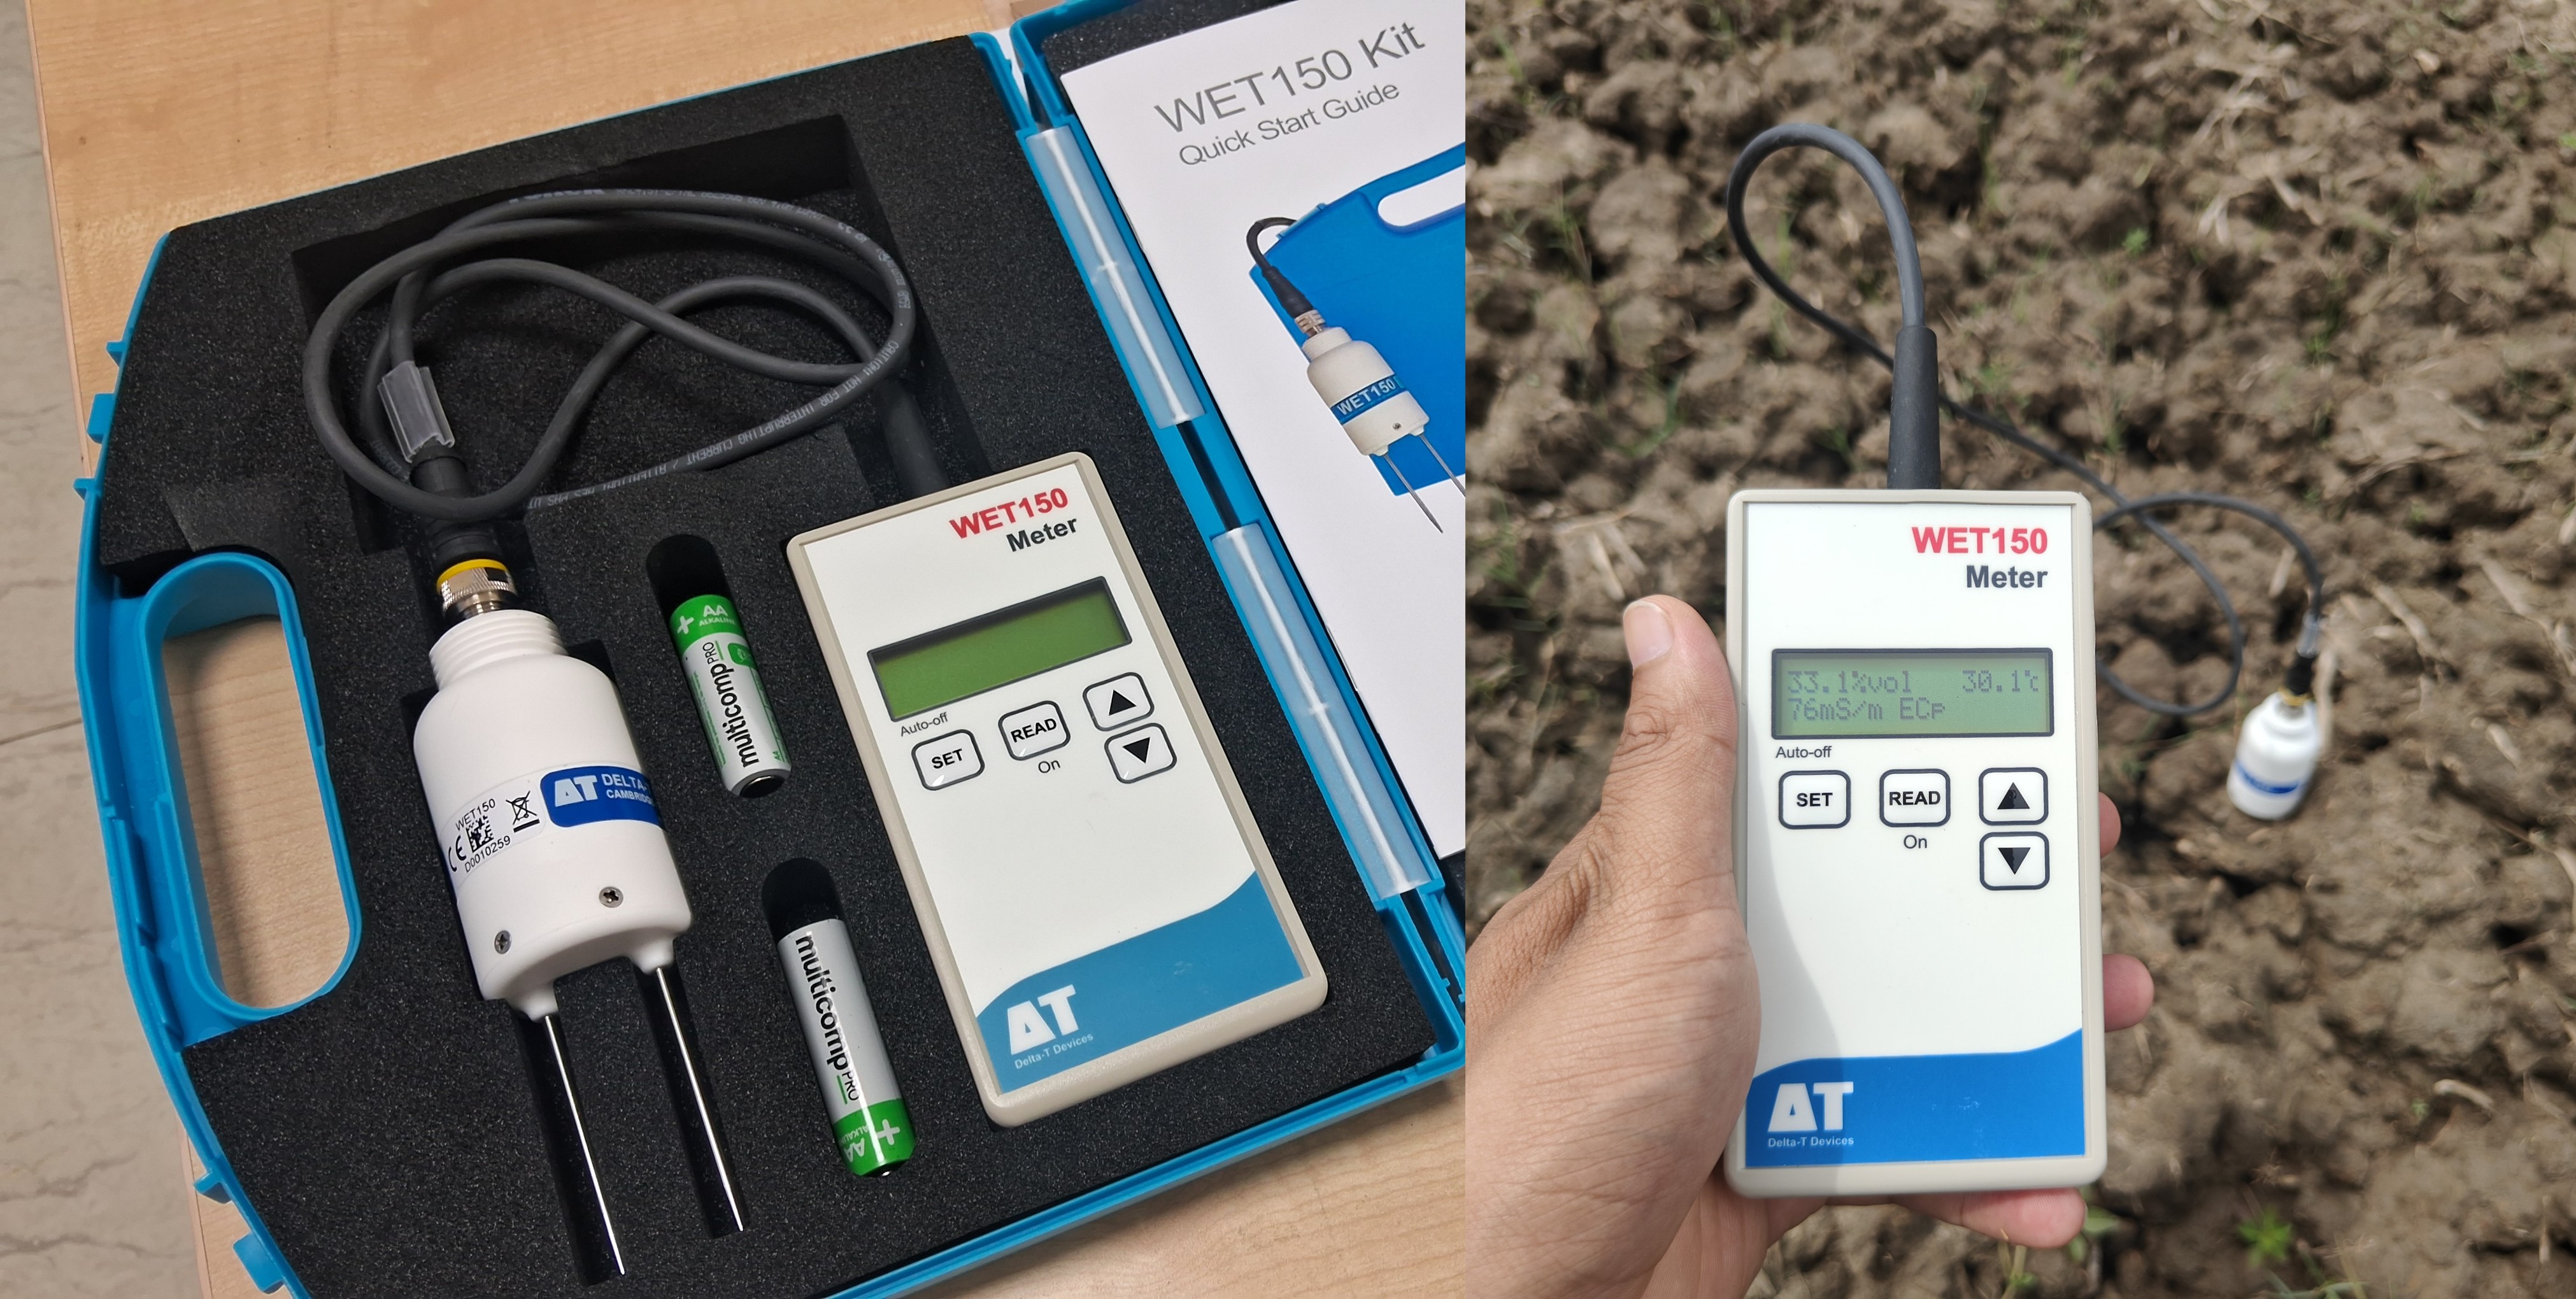
At each sample location, a total of 3 readings will be taken. Always insert the probe perpendicular to the soil surface as shown in the figure. Each sample location will avoid large cracks, dry clods or areas that have been heavily compacted by tractor wheels or foot traffic. Samplers must take care not to push the moisture probe in too far and cause compaction, especially if the soil is loose.
B. Vegetation Sampling The following vegetation properties will be measured for each sampling plot. VG1: Plant Count VG2: Row and Plant Spacing VG3: Plant Area Index (PAI)/LAI and fCover VG4: Biomass and Canopy Water Content VG5: Leaf Chlorophyll Content (SPAD) VG6: Crop Height VG7: Phenology
VG1: Plant Count The density of plants will be determined by counting the number of plants in a row along a fixed distance of 1 meter. This will be replicated for a total of 3 counts per sampling plot by moving perpendicular to the rows. Counts will be recorded on data sheets and used with row spacing to calculate plant density.
VG2: Row and Plant Spacing Row spacing will be determined by measuring the distance between rows at each location where the plant counts are made. At each location, after the plant counts are made, the meter stick will be turned perpendicular to the row direction. At the soil level, the total distance will be measured between the centers of the two plant rows immediately adjacent on either side of the row on which the plants were counted. Row spacing will be recorded on data sheets. Plant density (PD) will be calculated as: Plant Density PD = Average number of plants in 1m/ Average row width in 1m.
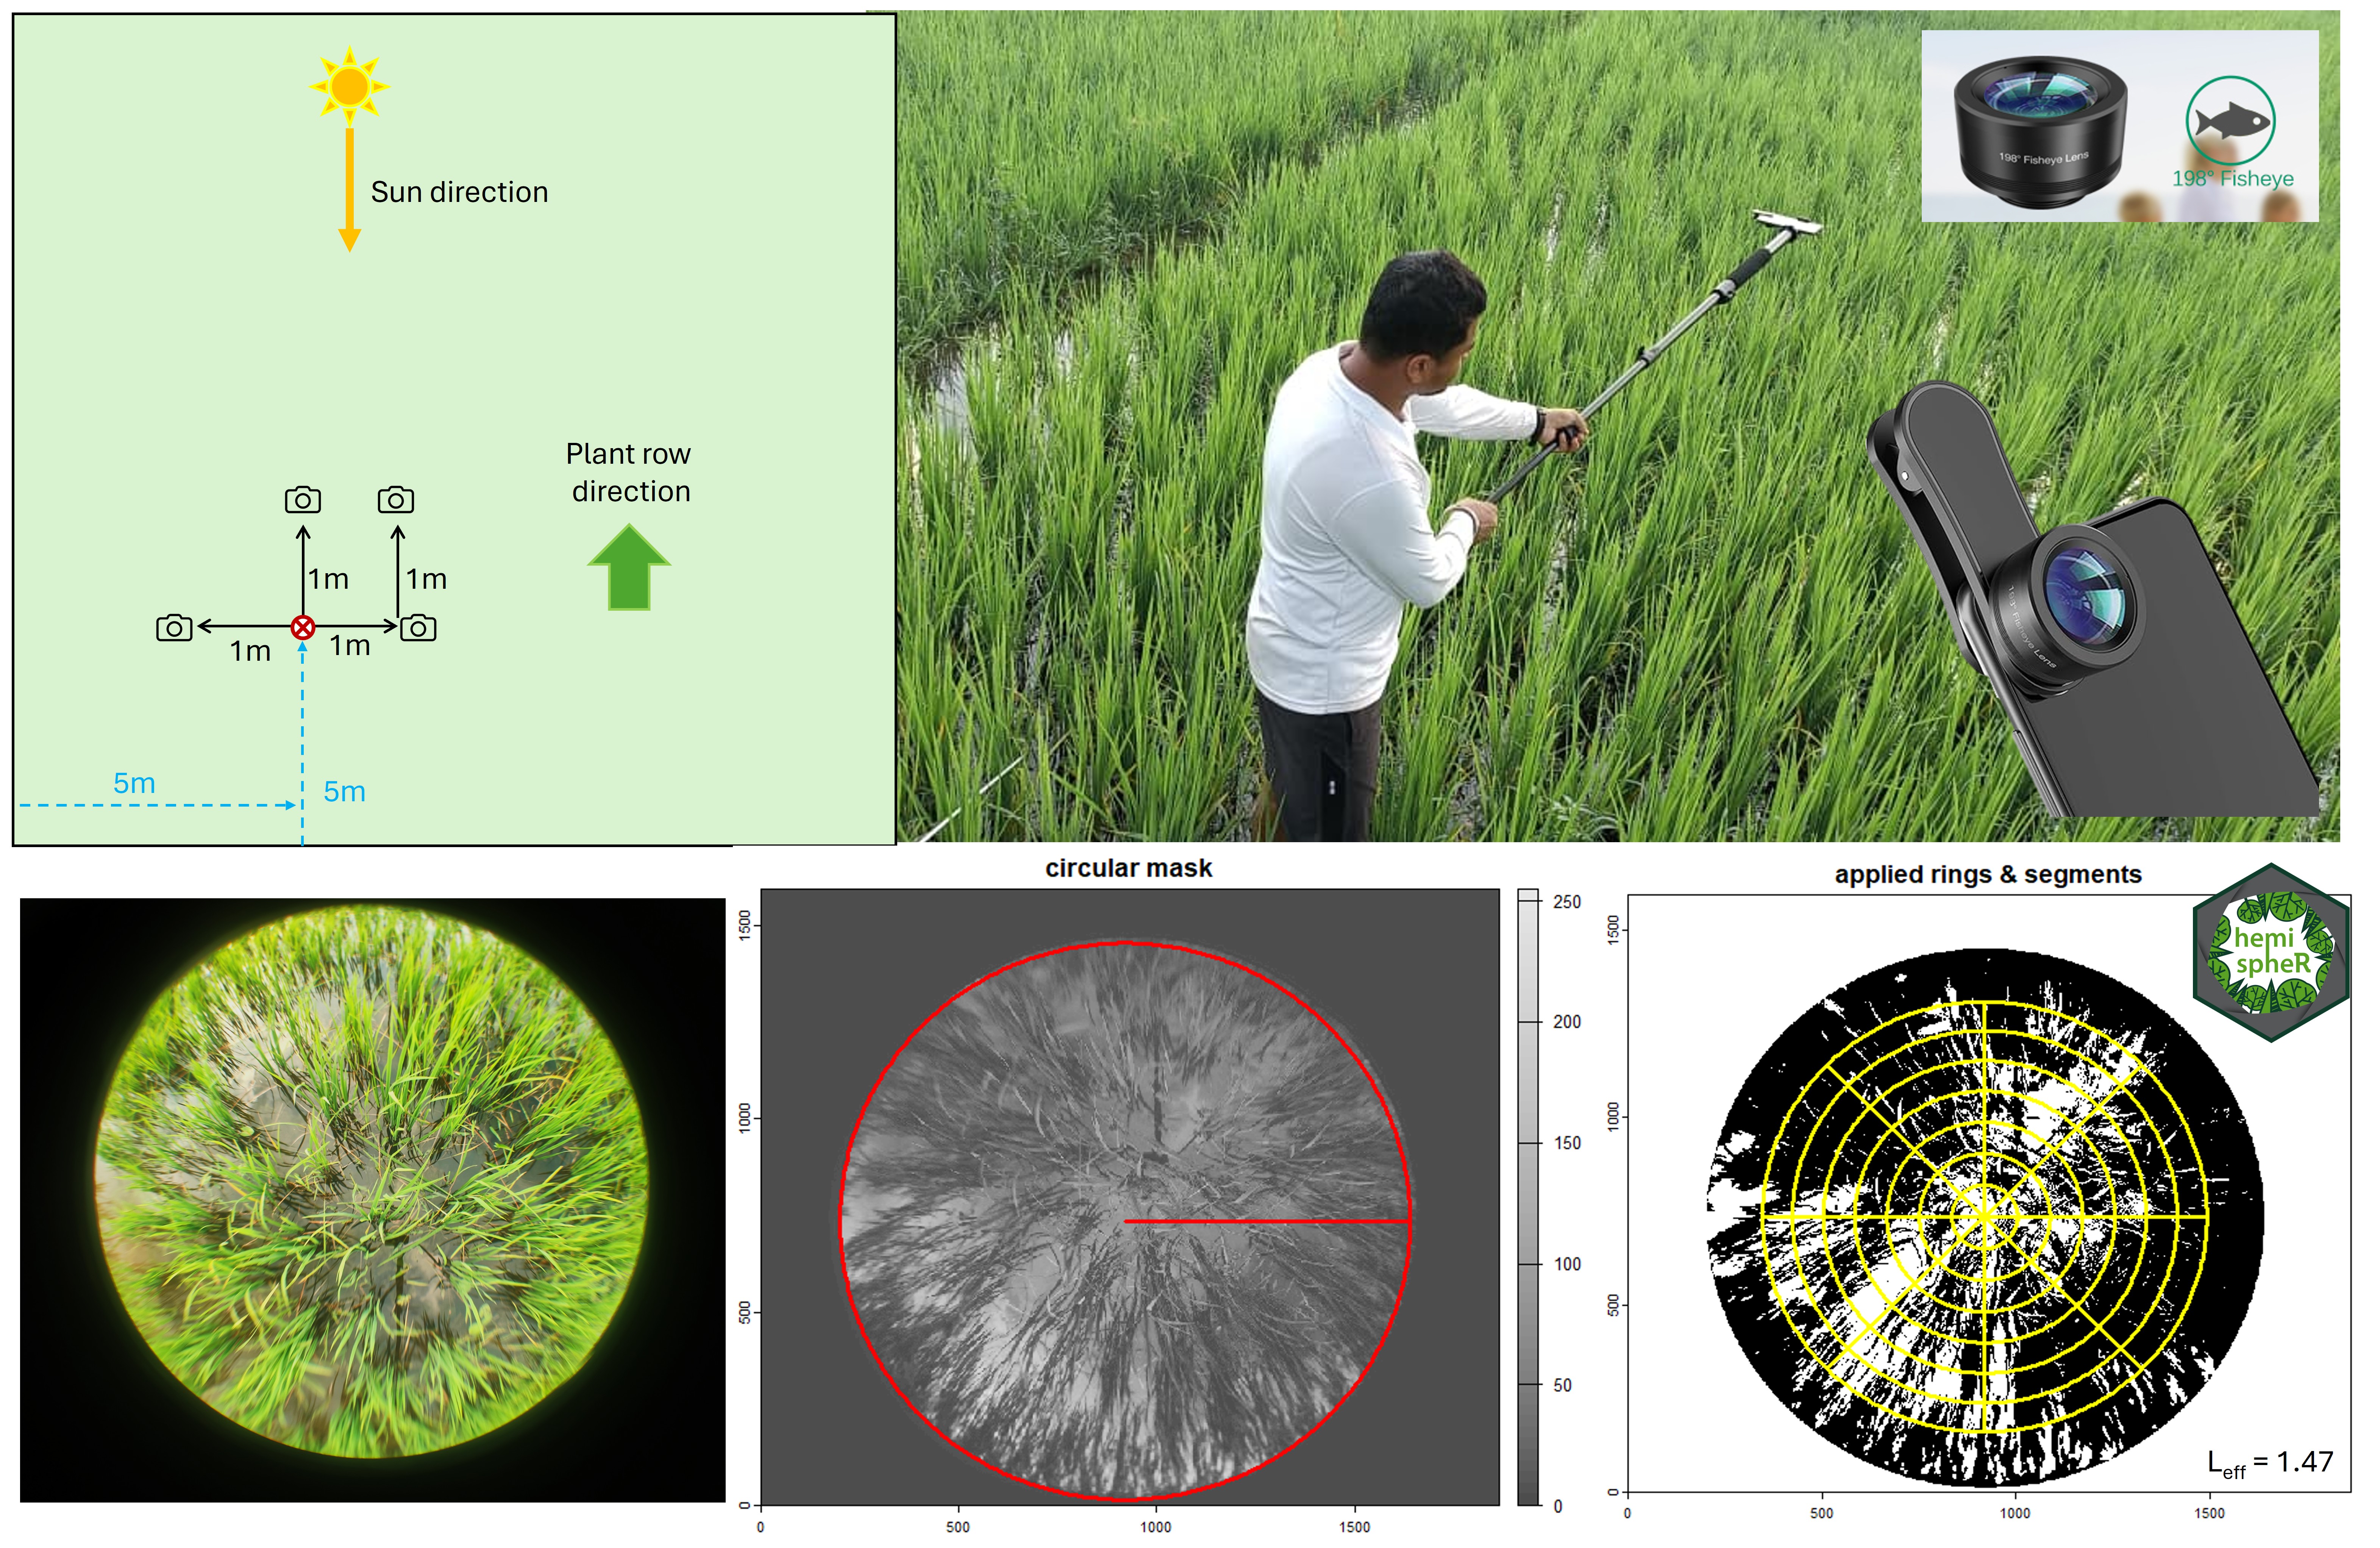
VG3: Plant Area Index (PAI)/LAI and fCover Plant area index (PAI) can be measured using digital hemispherical photographs. With this technique a wide-angle or fisheye lens captures all sky directions at the same time. When canopies are small, the photos are taken with the lens pointed towards the ground. The fisheye photos record the geometry of the plant canopy obstructing the field of view of the soil or sky. An advantage of this method relative to other in situ approaches (such as the LAI2000) is that the data capture is much less sensitive to sky conditions. Plant canopy analyzers such as the LAI2000 require diffuse sky conditions, restricting data capture to early morning or evening collection or collection under consistent overcast conditions. As well, high errors will occur when attempting to capture the LAI of very short vegetation (or early emerging vegetation) as the distance from the lens to the canopy is too small. PAI will be captured using hemispherical digital photos. Four photos will be taken along one transact at each of the sampling plot. These photos will be post processed using the hemispheR package in R to provide an estimate of PAI.
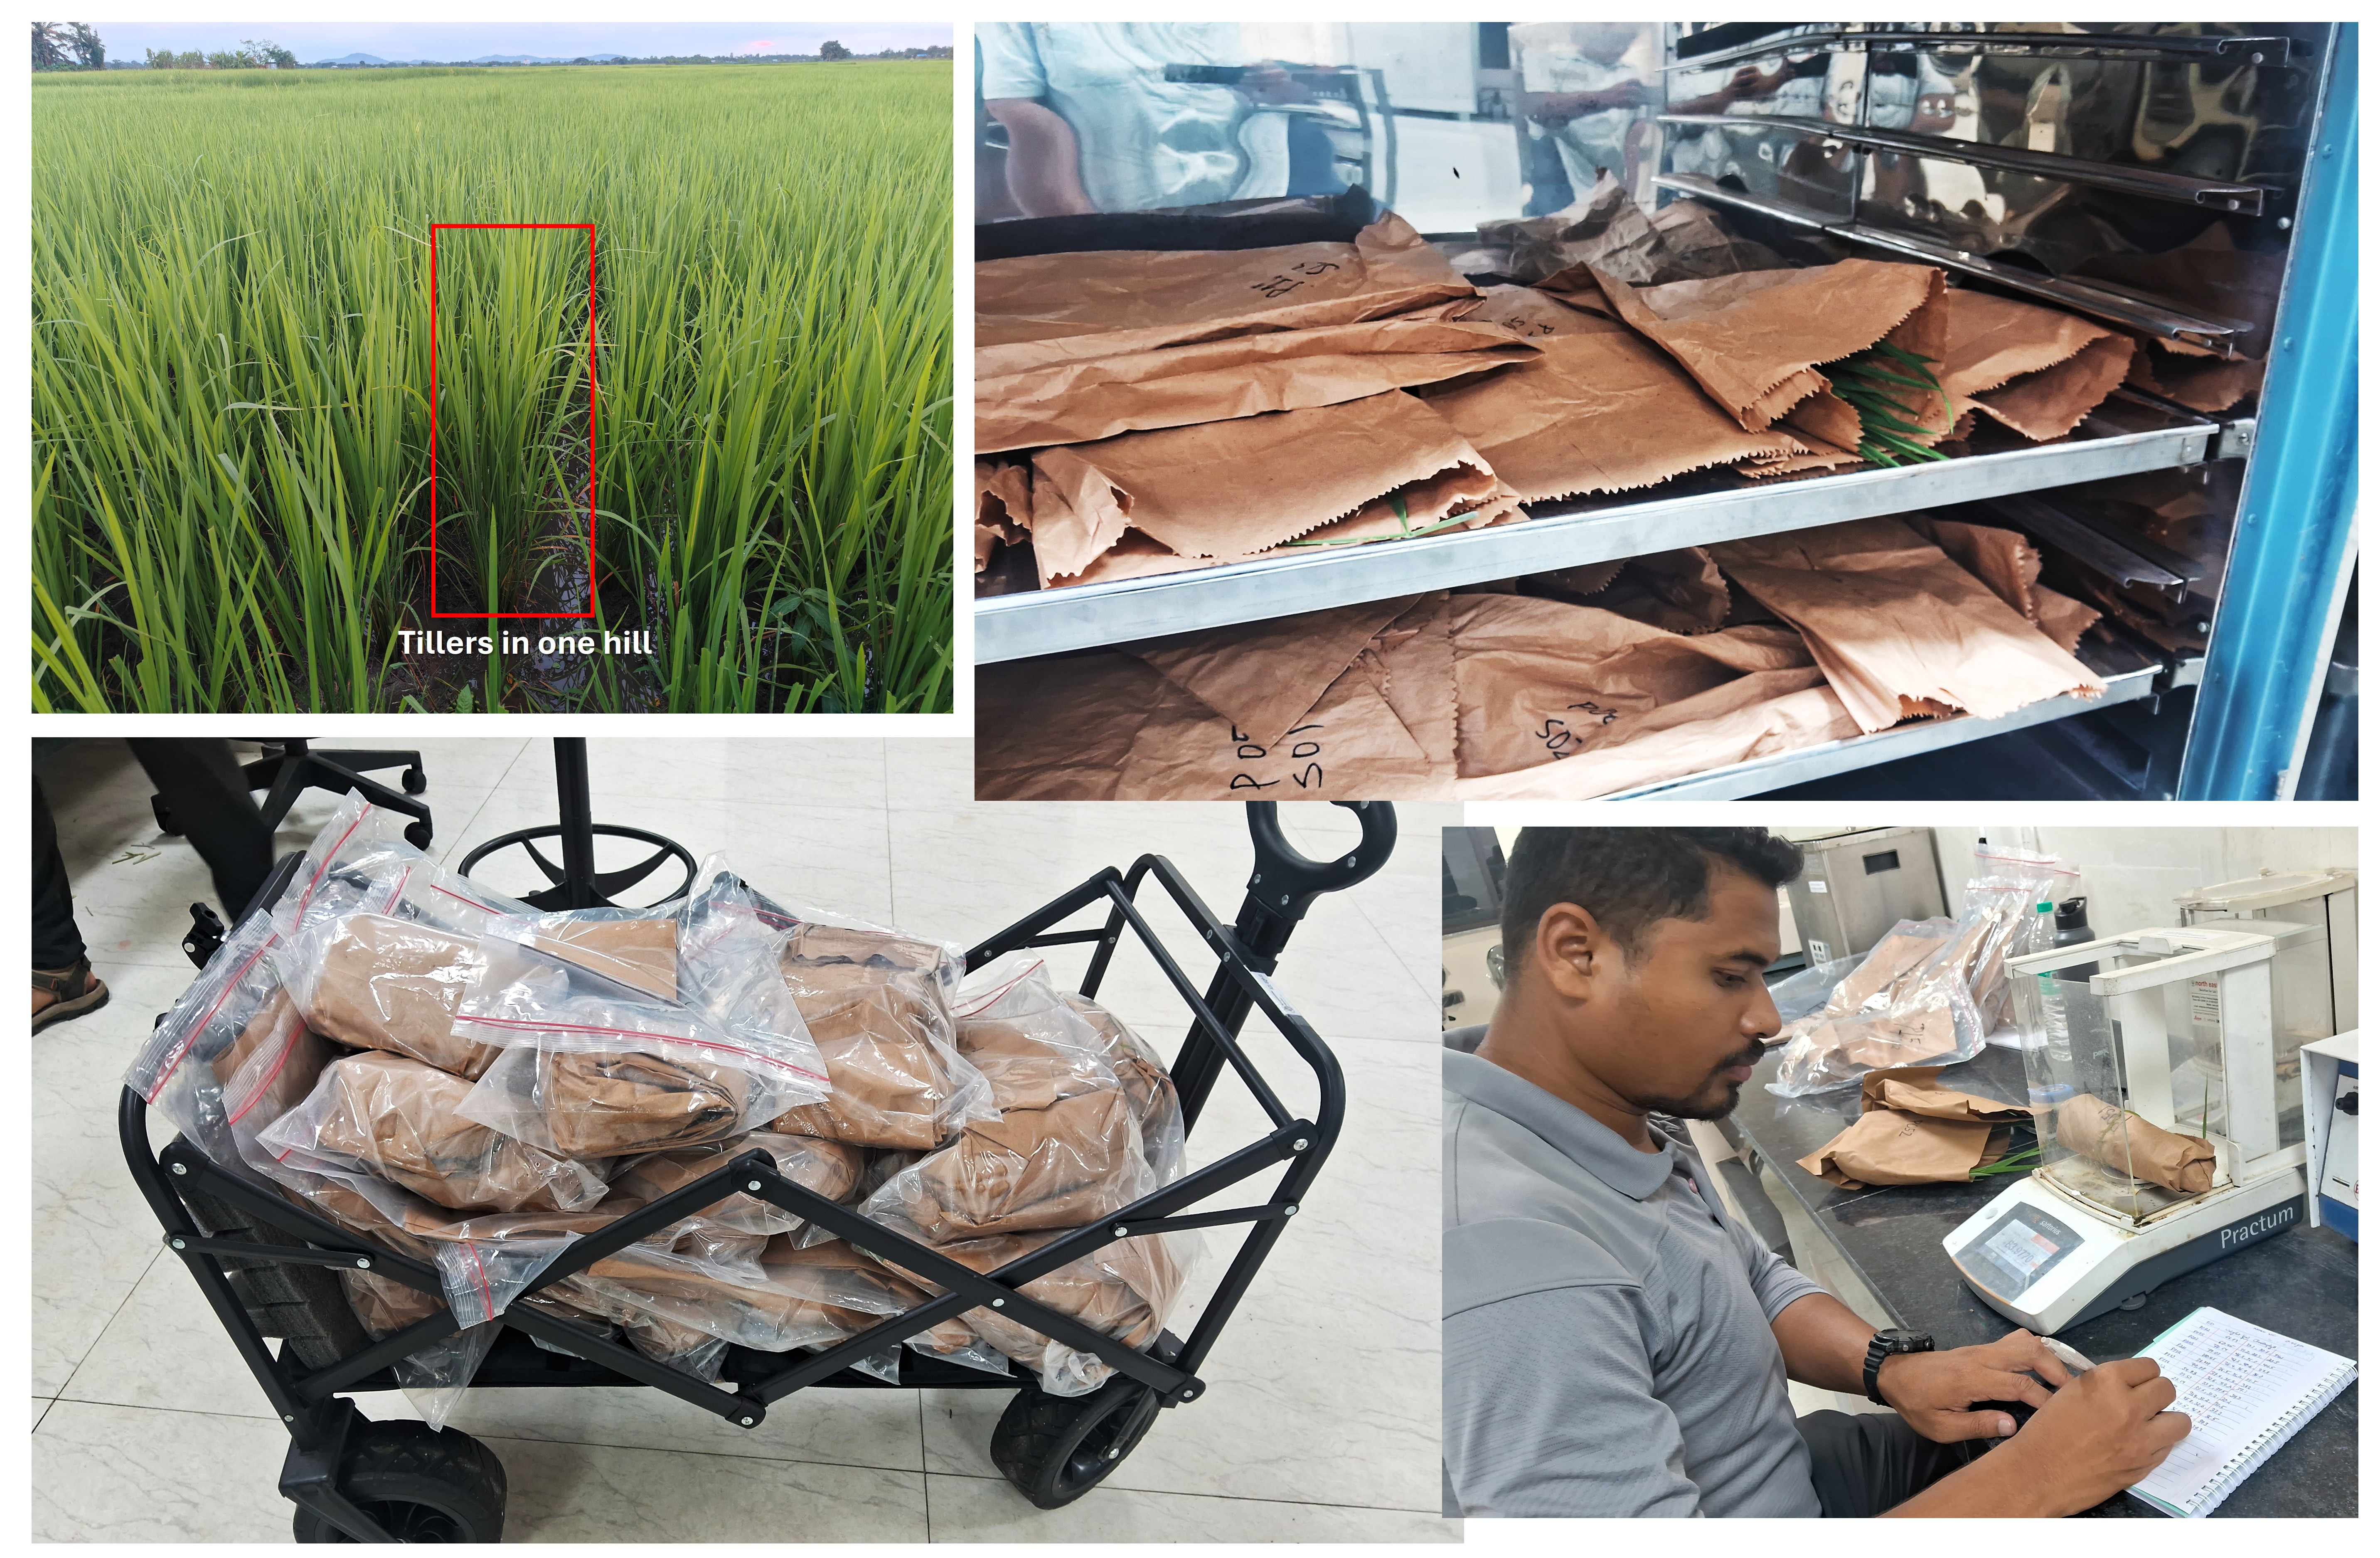
VG4: Biomass and Canopy Water Content Vegetation biomass will be collected via destructive sampling. Canopy water content is derived from the biomass samples. One biomass sample will be collected per measurement plot. For rice, plants from one hill (single clump of rice plants that grow together, formed by transplanting one or more seedlings into a specific spot in the field. The bunch of all tillers within a rice hill are the side shoots or stems that arise from the main stem) will be collected. All above ground biomass will be collected by cutting all vegetation at the soil level. With a knife, cut the crop at the base of each plant. Place the crop in a labeled paper biomass bag. The top of the bag can simply be rolled down. Then place the paper bag inside a plastic zip-bag. Secure the plastic bag with a firm knot/zip. If the plants are wet with dew, gently shake the vegetation prior to bagging. Keep the sample with paper bag in hot air oven at 60° C for 2-3 days. Plant water content (PWC) will be calculated as: Plant Water Content (PWC) (g) = (Wet Weight (g) - Plastic Bag Weight (g)) - Dry Weight (g). Later, plant water content will be scaled to an area basis (grams of water per m2).
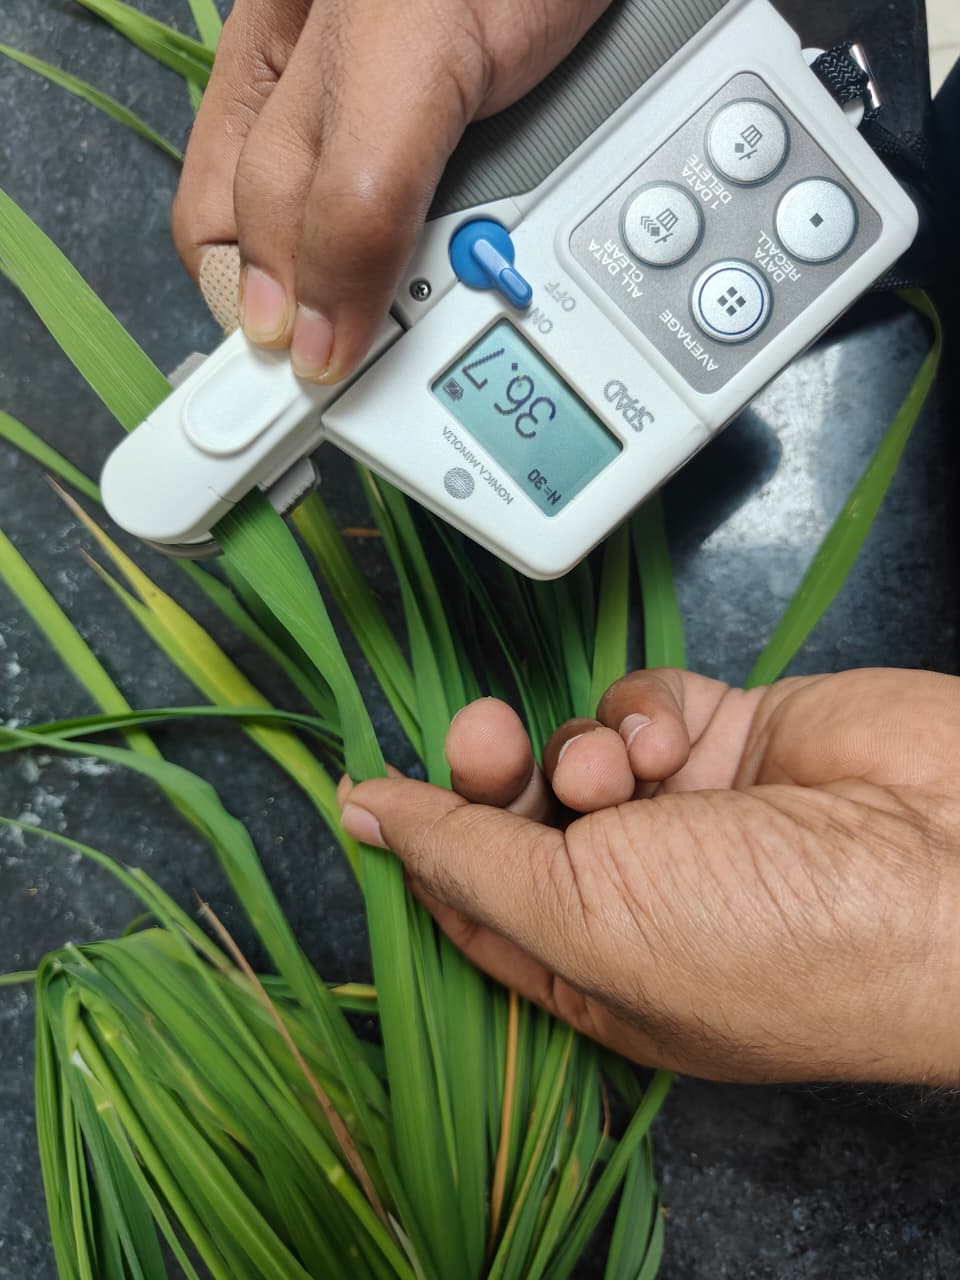
VG5: Leaf Chlorophyll Content (SPAD) Leaf chlorophyll content will be estimated using the Chlorophyll Meter SPAD-502Plus (Konica Minolta Inc., USA). Lef spot in the mid of leaf blade will be taken with three replicates in the above ground biomass samples.
VG6: Crop Height Crop height can vary significantly and increasing the number of measurements will help to improve the accuracy of the average crop height. Plants that are collected from the biomass sample are used for this measurement. In total, 5 heights will be measured, 2 in each of two rows. Leaves are to be left in their natural orientation, and not extended, for this measurement. Heights can be measured before or after biomass sampling (whatever is easiest) and recorded on data sheets.
VG7: Phenology The Feeks scale will be used for phenology determination in each sampling location (visulaizing vertical photos and biomass samples).
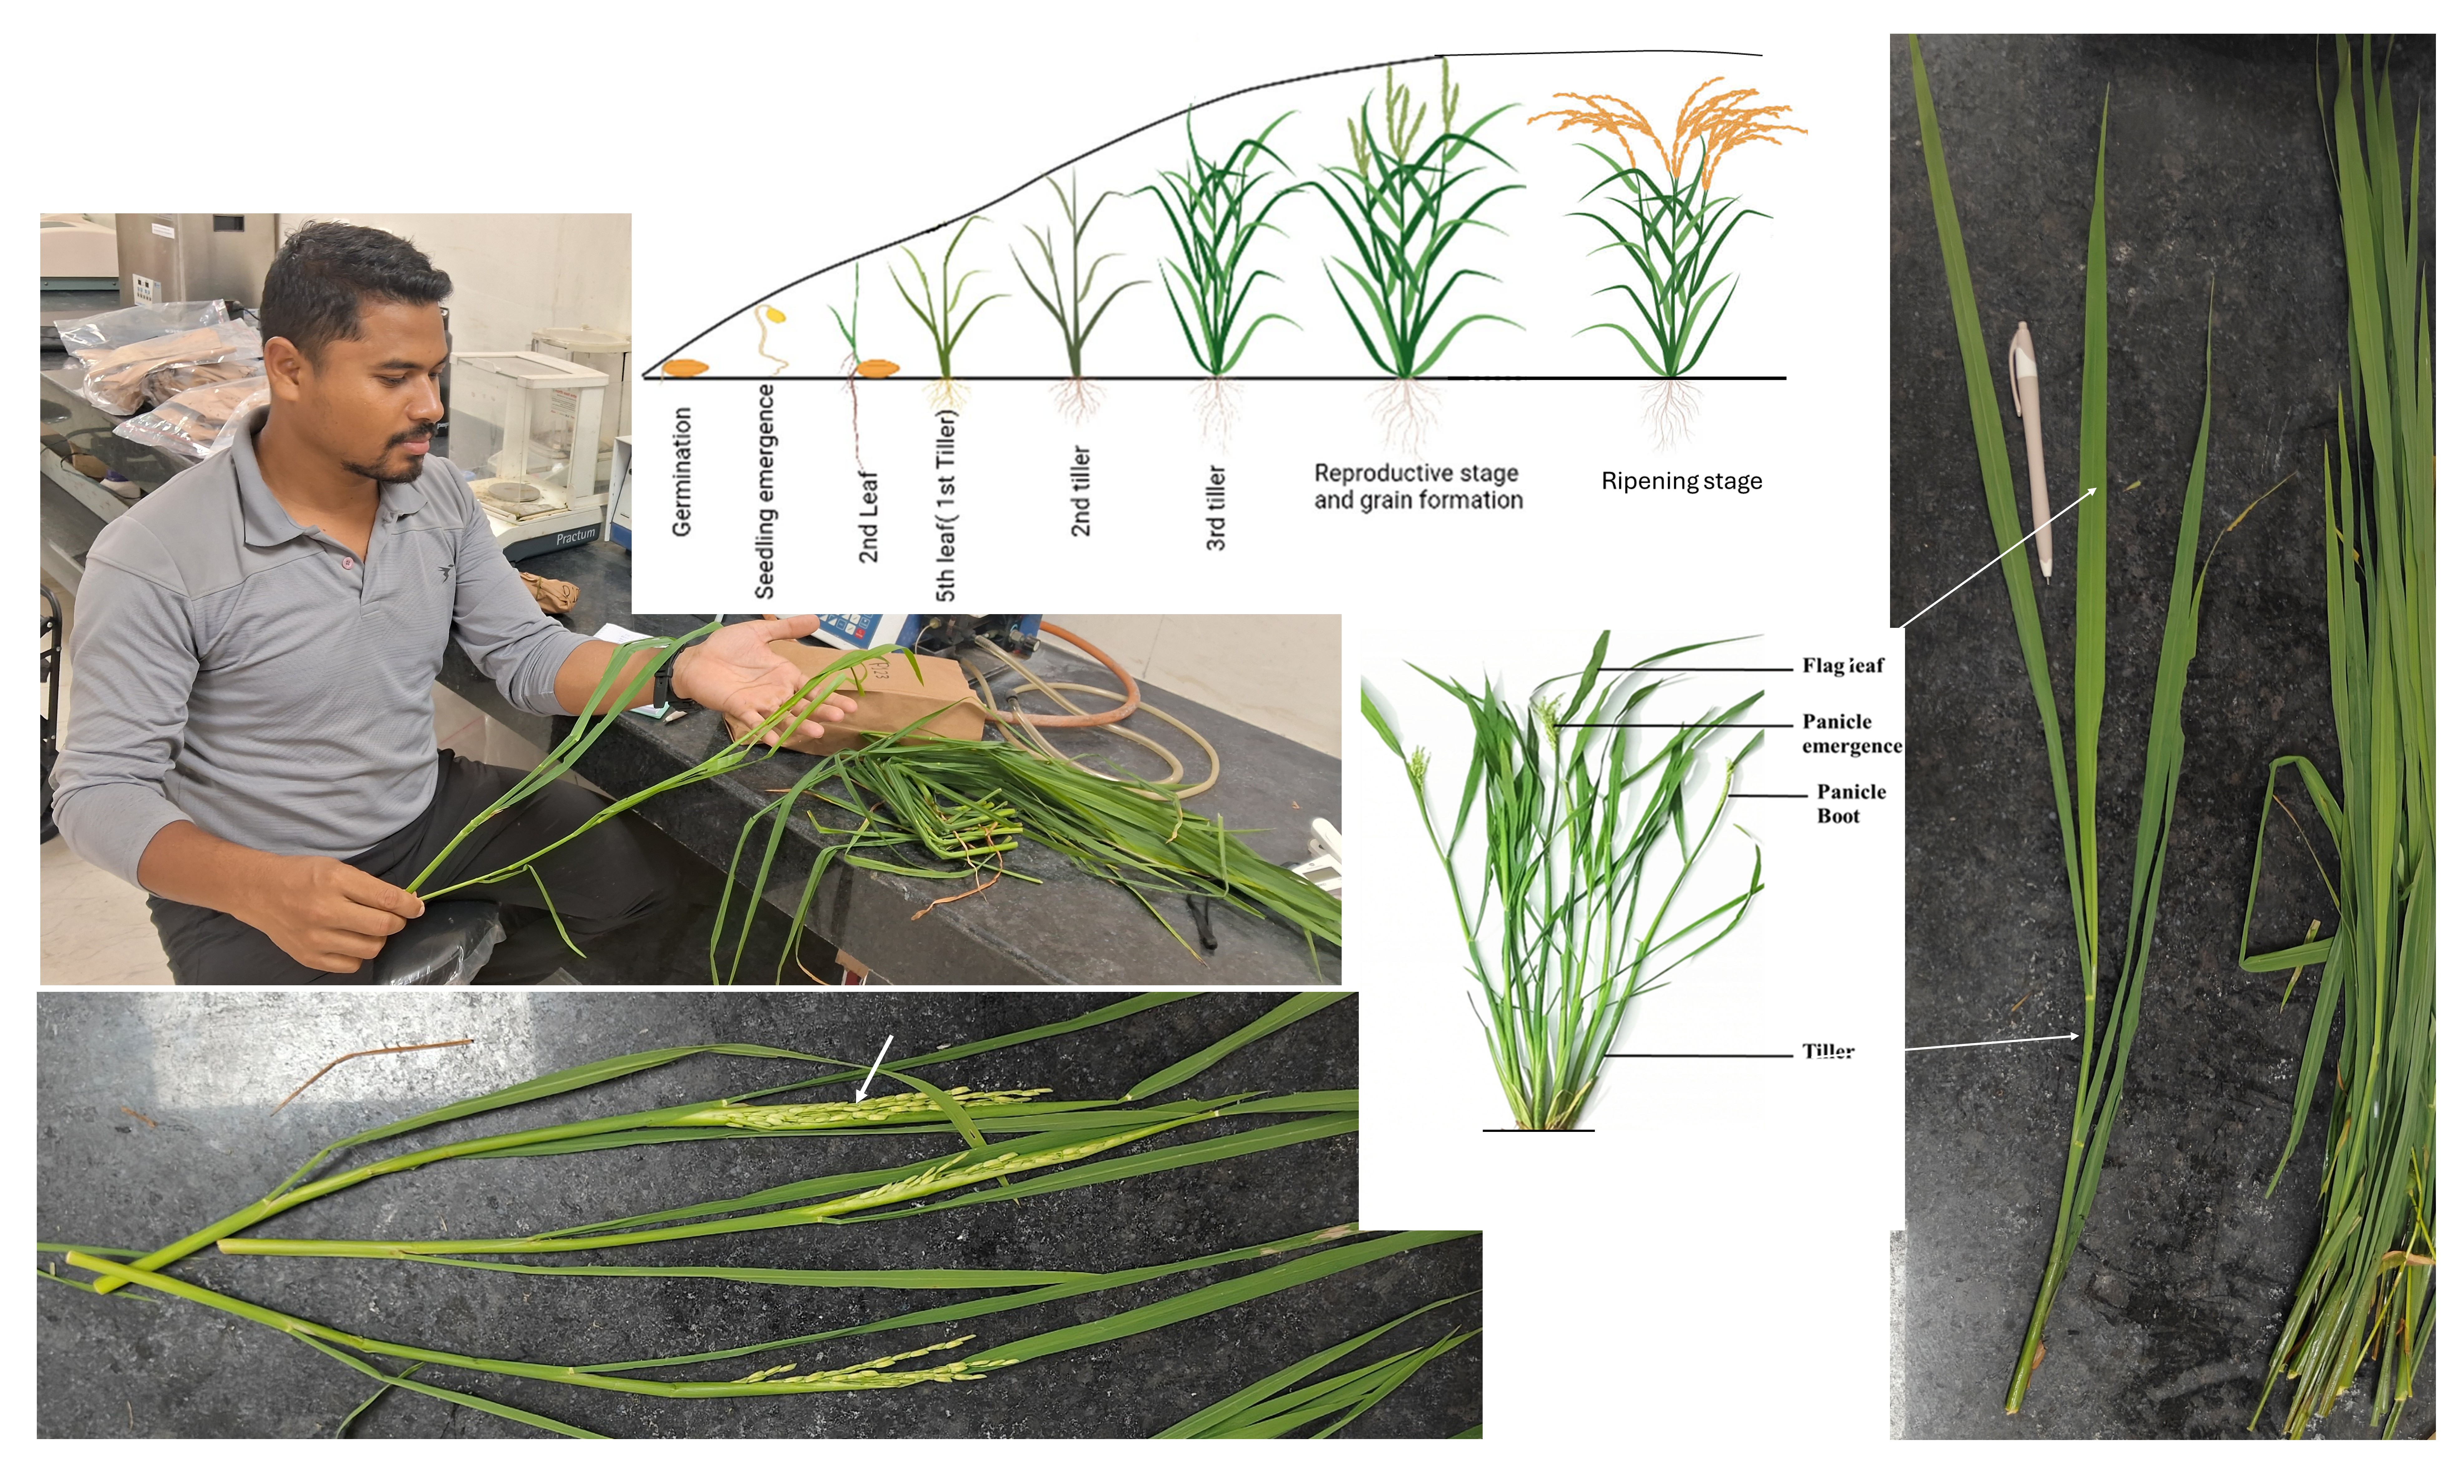 [Ref: Mohapatra et al. (2025). Staging of Rice Plant Growth and Development. In: Tillering Behavior of Rice Plant. Springer, Singapore. https://doi.org/10.1007/978-981-97-5235-5_4]
Partners and EO-data Agency